


Read the rest of the post ' Supersized cruise ships sound the alarm for (re)insurance industry '

The last two years of windstorm losses in Japan have been extreme. While the reinsurance industry is used to seeing big losses from US hurricanes, that’s not historically been the case for Japanese typhoons and has led Hiscox to undertake a fundamental reappraisal of windstorm risk in that region.
One advantage from the loss experience of the last two years is that reinsurers now have more data points to validate its catastrophe models against. Before 2018, you had to go back to 2004’s Typhoon Songda and before that Typhoons Bart in 1999 and Mireille in 1991 to find comparable events. To have three storms bigger than USD$5 billion in the last two years – and one, Hagibis, with lots of flood – provides a golden opportunity to reset the models we use.
What Hiscox’s Research team discovered however, was that when comparing actual client loss experience to client modelled losses, actual losses were much greater. This prompted the team to look at where the models need to evolve with a focus on hazard, vulnerability, data quality, and climate change.
Urban winds
Hiscox Research team found that the hazard element in the models being integrated into the Hiscox View of Risk seems to be largely robust, but there is some concern around increase in wind gustiness due to the phenomenon of ‘urban canyons’. Tall buildings in urban areas create what is known by boundary layer meteorologists as an urban canyon which can funnel winds, increasing the speed of wind gusts and decreasing the sustained wind speeds.
During Typhoon Jebi for example, a recent study estimates that maximum wind gusts in Osaka were up to 60-70 m/s (135-155 mph), while an observation outside of Osaka, which would not have experienced the effects of an urban canyon, recorded a gust of 47.8 m/s (106.9 mph).[1] There is a possibility that the effect of urban canyons is not adequately captured in industry catastrophe models.
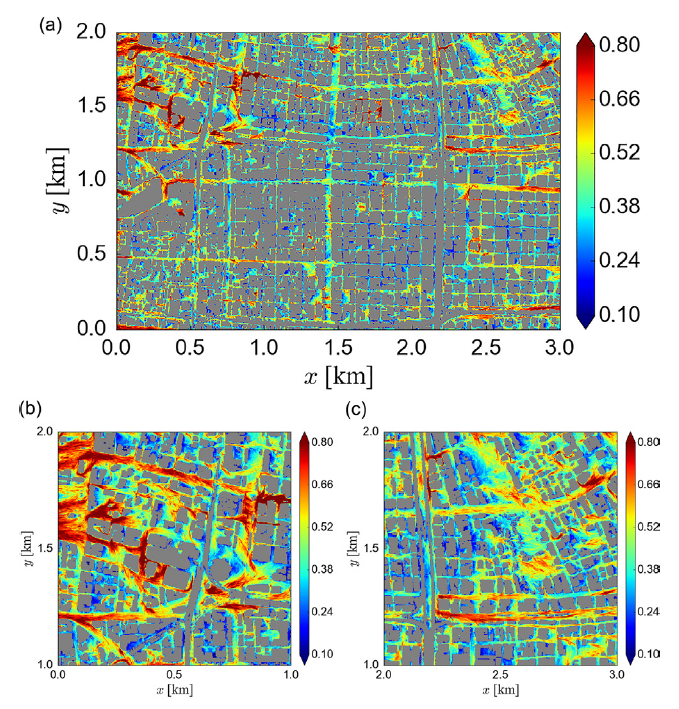
The spatial distribution of the maximum wind speed in downtown Osaka
 |
|
Takemi, T., T. Yoshida, S. Yamasaki, and K. Hase, 2019: The spatial distribution of the maximum instantaneous wind speed at the 10-m height from the time series of the wind speed at each grid point for (a) the whole computational area, (b) the area in the top left of (a), and (c) the area in the top right of (a). All the wind speed are normalised by U. |
Bias in high wind speed vulnerabilities
Turning to vulnerability, Hiscox has carried out some comprehensive testing of various vendor model vulnerability curves and it is clear there is uncertainty and potential bias in high wind speed vulnerabilities. Given the nature of storms like Jebi with very strong wind speeds in urban areas, we suspect that high windspeed vulnerability – largely down to the lack of empirical data from past events – is contributing to model miss. More certainty is expected to come from work being done by Texas Tech University National Wind Institute and the Centre Scientifique et Technique du Batiment (CSTB) in various wind tunnel experiments being carried out this year.
Exposure data granularity
Alongside vulnerability, one of the biggest issues is the quality of exposure data which has long been a problem when rating Japanese windstorm risk. Vendor models rely on accurate data but there is an obvious shortfall when it comes to location of the risk and secondary modifier coding. In the US, it’s usual to get data down to address level or the exact latitude and longitude coordinates for each building. This level of accuracy is less common for Japanese property risks. Reinsurers are more often only provided with aggregated data related to city wards which can make accurate modelling, especially of the flood element, almost impossible.
Challenging inertia
More accurate and detailed exposure data will obviously make it easier to accurately price the risks. To a certain extent this is a problem of reinsurers’ own making given that the granular level of data has not been requested in the past. And, as we know – if you don't ask, you don't get. At the same time, we can’t expect Japanese insurers to rapidly change long standing practices. It will take some time and a joint effort between local insurers and international reinsurers to develop better understanding of the underlying exposure data. We have to work together to facilitate change and increase transparency, starting with the biggest players in the market. If they can lead the way, the rest of the market will follow suit. Ultimately risk will be better understood and more effectively priced to the benefit of the entire eco-system of reinsurers, insurers and customers.
Climate change
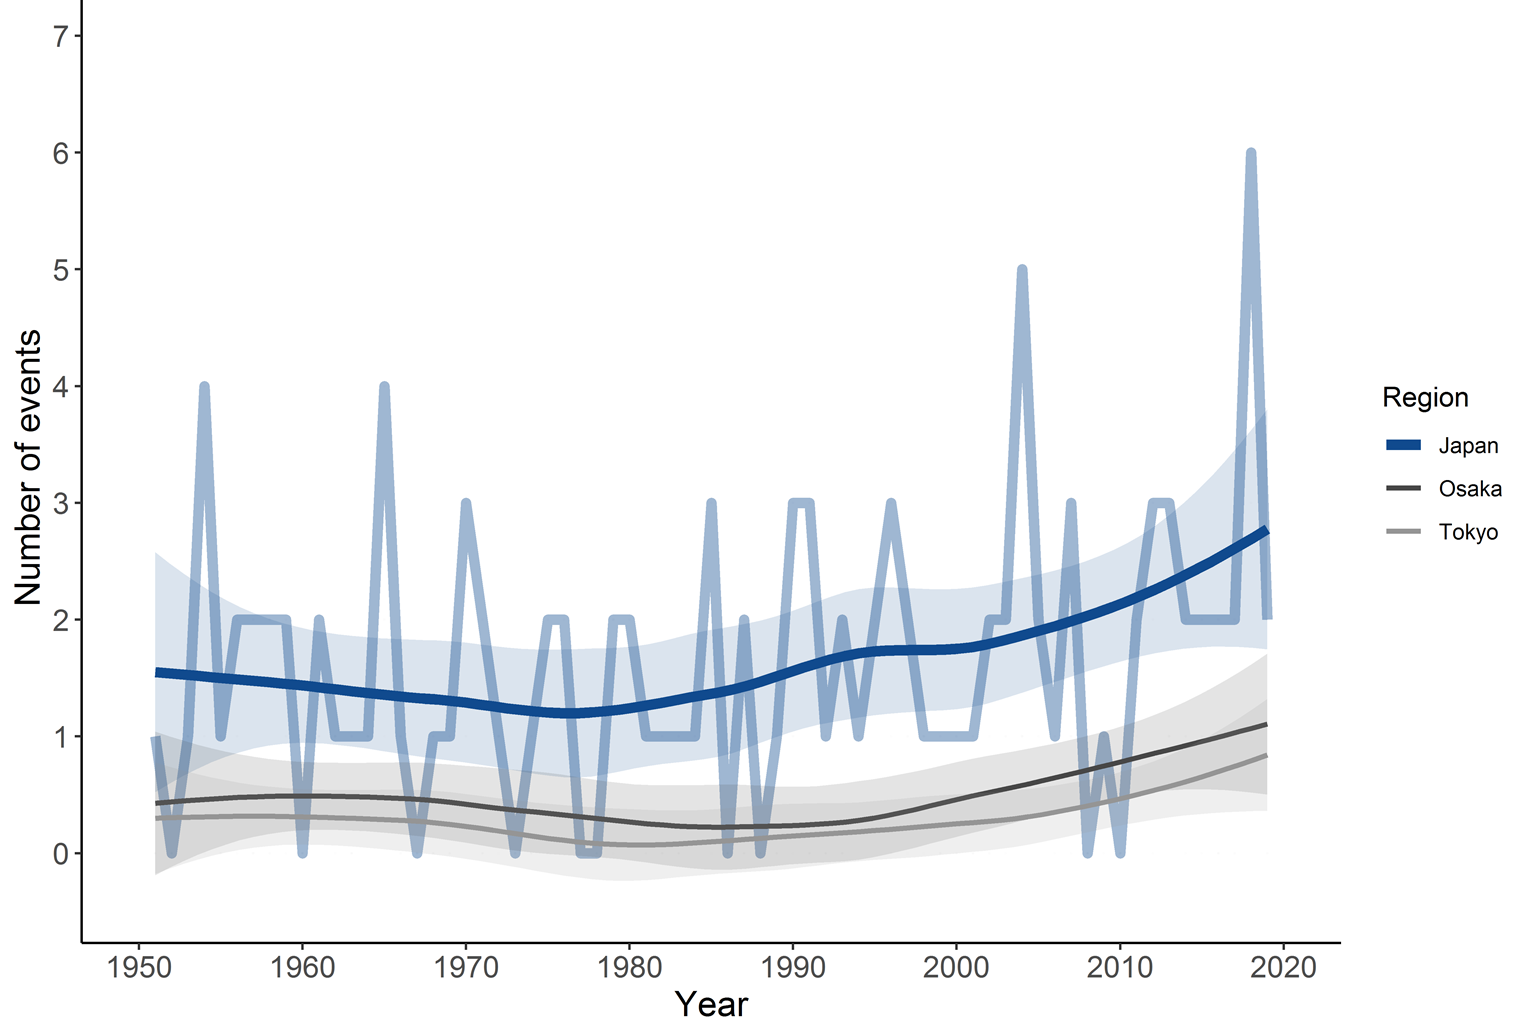
The final element to consider is the impact of climate change. Hiscox research shows that while the total number of storms has not meaningfully changed in recent years, there has been an increase in the frequency of large (Category 3+) storms within 150km of Japan over the last decades.
Total number of category 3+ events per year
 |
|
International Best Track Archive for climate Stewardship (IBTrACS), NOAA. Using central pressure data converted to Saffir-Simpson scale intensity and a 150 km buffer around mainland Japan. The shaded areas around the solid lines trend denote the confidence interval around the mean. |
In addition, a review of available peer reviewed scientific research revealed that there has been an observed shift in the latitude at which storms reach their maximum intensity in the Northwest Pacific, putting Japan at greater risk. This would seem to be a clear indication of climate change in that region; a perhaps more definitive trend than in any other major geography where insurance penetration is high. Looking ahead, this change will be accounted for in the Hiscox View of Risk.
Change in latitude of maximum TC intensity (corrected for [a] ENSO and PDO, and [b] AMO)
![Change in latitude of maximum TC intensity (corrected for [a] ENSO and PDO, and [b] AMO)](/sites/re/files/inline-images/Graph%203.jpg) |
Reset our view of risk
The recent storms, while inflicting big losses, have given us new data with which to take a fresh look at vulnerability and hazard in the region, to reassess the quality of data, and all whilst taking account of climate change.
This year’s renewals were an opportunity to reset and materially revise our own Hiscox View of Risk; to use the science and the loss experience from Jebi, Hagibis and Faxai to ensure we rate Japanese windstorm risk accurately in order for us to continue to be meaningful and sustainable partners for our Japanese clients both now and well into the future.
Find out more about our property reinsurance team and their product offering here.
[1] Takemi, T., T. Yoshida, S. Yamasaki, and K. Hase, 2019: Quantitative Estimation of Strong Winds in an Urban District during Typhoon Jebi (2018) by Merging Mesoscale Meteorological and Large-Eddy Simulations. Scientific Online Letters on the Atmosphere, January 2019. DOI: 10.2151/sola.2019-005
