
Read the rest of the post ' Navigating the challenges of aggregate pricing '

Windstorm Christian and the Great Storm of ’87
By:
Despite the contrasting loss experience, Richard Dixon, Head of Catastrophe Research at Hiscox, finds 2013’s Windstorm Christian and 1987’s Great Storm have more in common than many might think.
Much was made in the mainstream media that last October’s Windstorm Christian – which only had a moderate impact on the United Kingdom – was far removed from the infamous October storm of 1987. However, digging a little deeper into the lifecycle of these two events reveals they were a lot closer in characteristics than initially meets the eye and are both good examples of a class of windstorm that has the potential to be particularly damaging.
A sting in the tail
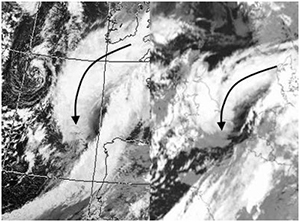
Even though the UK only typically experienced inland winds from Christian of up to 70 mph – enough to start dislodging roof tiles and knocking over weaker trees – the satellite imagery gave clues that it was going to be quite a threat to the countries that lay downwind of the weather system. Comparing the satellite imagery of Christian and the 1987 storm shows very interesting similarities. In the image below we see an arrow marking the development of a ’cloud head’ that signifies the intensification of windstorm. By chance or otherwise, Christian’s cloud head was very reminiscent of that of the 1987 storm. The systems shown here were both around nine hours away from their maximum intensity.
This cloud feature is now very well recognised by forecasters; it wasn’t in 1987. It is a measure of the advancement of our understanding that we now understand these features better.
At both these times the systems were still developing. In 1987, the storm was over the sea while Windstorm Christian was doing its development over land which will provide meteorological researchers with a rich seam of information to further understand how these storms develop and their attendant hazard. Strong winds were reported from the system in a band from South Wales through to North London in Windstorm Christian, but some more significantly strong winds were felt in the eastern counties of the UK at the time of the above image. This turned out to be a sign of what was to come for The Netherlands, Northern Germany, Denmark and Sweden.
The enigmatic 'sting jet’
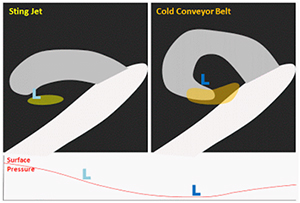
What eastern England experienced in Windstorm Christian was the beginning of the most damaging phase of the system. As the cloud feature begins to wrap around the system it signals the development of one flow – and sometimes two – that cause most of the damage we usually experience in a European windstorm (simplified below). In the first phase of development, a ’sting jet‘ can descend from the cloud head from around 3-4km above the Earth’s surface in staccato bursts: but this doesn't always happen and is an enigmatic feature of windstorms. In the second phase of development, a low-level flow called the ’cold conveyor belt’ becomes dominant and causes most of the damage; its presence is more reliable and common than the sting jet. An idealised schematic below shows what one might suggest as two ‘phases’ of the storm’s development as dictated by the existence of these two flows:
- Schematic showing the position of the strongest winds at two stages of development of a damaging low pressure system. Top left picture shows the location of the sting jet, top right shows the location of the cold conveyor belt. Bottom chart shows the timing typically of when these features exist relative to the central pressure of the storm.
- Schematic showing the position of the strongest winds at two stages of development of a damaging low pressure system. Top left picture shows the location of the sting jet, top right shows the location of the cold conveyor belt. Bottom chart shows the timing typically of when these features exist relative to the central pressure of the storm.
The two charts at the top of the schematic are a simple example of the cloud pattern and the attendant strongest wind flows at the time. The left chart is intended to depict what we see in the satellite images (mentioned earlier) as it is undergoing rapid development. The sting jet exists close to and ahead of the tip of the cloud head. The right image shows the storm when it is fully-developed and at its most intense, and position of the ’cold conveyor’ belt strongest winds which usually undercut the sting jet and become the dominant damaging flow of wind.
The sting jet doesn't always exist and doesn't always cause damage in a windstorm; the cold conveyor belt is usually the cause of the strongest winds. The bottom chart plots the ’L‘ from each of the schematics relative to how low the central pressure is in the system. The sting jet occurs as the pressure is still dropping rapidly and usually the cold conveyor belt occurs when the storm is at its deepest. It is also worth adding that this is highly idealised: not all storms behave the same but it picks up some main points of developing storms that are relevant to this study.
Two peas in a pod?
Many of the storms we’ve seen in history only have the cold conveyor belt causing damage. What is interesting for the 1987 storm is that the south of England saw damage from the sting jet, and then the cold conveyor belt blew over the sea (and caused relatively less damage in Norway). What is currently being suggested (and researched) for Windstorm Christian is that both the damaging flows shown above were again present. There are hints that the sting jet caused patchy but quite localised damage in south-eastern England, and it is still up for discussion as to whether it also caused the damage in Holland, Germany and Denmark or whether by then the cold-conveyor belt was the key damaging flow.
Both flows being present in a windstorm could potentially extend the damaging lifecycle rather than just the one flow as they simply increase the area affected by damaging winds. Until recently the only definite example of the sting jet causing damage on land was in the 1987 storm: the storm in which it was discovered. By understanding better how common this type of storm is (once every five years? every fifty?) we can get a better feel for how frequent we should expect such long-track storms with the potential for damage – as was the case in Christian – from south-west England all the way to western Sweden. This is obviously of interest to those of us who are interested in understanding catastrophic risk and what sort of size and shape a typical long return period storm looks like – the sort of storm against which insurers and reinsurers alike want to protect themselves.
How strong were the two storms?
We can simply compare the strongest winds reported for these storms to get a feel for their relative strengths. The UK media spoke a lot about the storm being weaker than the 1987 storm, however this was only being couched from a UK perspective. In the 1987 storm, winds at Shoreham reached 120 mph (before the wind measuring instrument failed) and 122 mph in Gorleston in Norfolk. Pointe du Raz in France had gusts up to 134 mph.
The strongest gusts for Windstorm Christian, whilst reaching nowhere near this strength in the UK as the storm hadn’t reached its peak as it crossed this country, were relatively similar in Denmark: Kegnæs Fyr lighthouse close to the western coast of Denmark recorded 120 mph which turns out to be the strongest winds ever recorded in Denmark. In Germany, the same windspeed was also recorded at Borkum and Helgoland. It is telling that these systems that seemed to have a similar type of development both ended ultimately with extremely damaging gusts of similar magnitudes. Just as Denmark received its strongest recorded gust in Christian, the Shoreham gust recorded in the 1987 storm is quite likely one of the strongest (if not the strongest) wind gust measured in south-east England. This serves to underscore the parallels that these two storms have.
Forecasting the October 1987 Storm and Windstorm Christian
It is worth touching upon this as the public were warned five days in advance of the impending windstorm threat, which is an impressive lead time for a specific warning and much has been made of the advancement of science that enables this. In 1987, the storm was poorly forecast, leaving a rather embarrassing situation for the Met Office. Michael Fish could easily have pleaded “Don’t shoot the messenger” as, even then, numerical weather prediction forecast models were heavily used to inform forecasters’ decisions – as they are now. Four things have happened since that unfortunate day that could well have improved forecast accuracy:
- better understanding of how we simulate the myriad processes in the atmosphere;
- how and where we capture the observational data that informs forecasting models if the ’initial state‘ of the atmosphere before it is projected forward in time;
- the higher resolution of forecasting models: i.e. they can resolve more detail of the atmosphere and that includes the intensity and damaging flows of developing weather systems;
- the forecaster’s understanding and recognition of rapidly developing windstorm situations:
as mentioned earlier, we now understand better the signatures of rapid development in satellite imagery.
All these things add to more accuracy from models and forecasters alike. However, some storms are simply more ‘forecastable’ and are less on a knife-edge such that models are able to predict them well. Christian was spotted some five days out and flagged as a possible storm. However in 1990, using practically the same technology that had mis-forecast the 1987 storm, the Burns Day Storm (otherwise known as ’Daria‘) was forecast extremely well.
As if we need a reminder of the fickle nature of forecasting severe events, in January 2012, forecasters had spotted Windstorm Andrea was going to hit Scotland with strong winds. It was only by the morning of the event that they had to increase the warnings to the highest level when it became evident just how strong the storm was. With this in mind – we will have to accept that not all future windstorms will necessarily be perfectly forecast – there may still be another October 1987 Storm that takes us by surprise. But we do have the back-up that forecasters now have more tools and knowledge available to them to spot an ’unforecast’ event and minimise the surprise to us.
For now however, we now have another windstorm to research in order to improve our understanding of European windstorms - both from the perspective of the meteorological and catastrophe risk communities.
